

Cyclone Arnab Case Study: Forecast, Landfall & Response (Part 2)
A student-friendly case study comparing Cyclone Arnab’s forecast, landfall and early response, with a timeline, evidence checks, reported impacts and FAQs.
Did Cyclone Arnab behave exactly as forecasters predicted? The broad landfall area and dangerous wind strength were forecast well, but the crossing took longer than an earlier short-range time window suggested. That difference is a useful lesson: forecasts are updated as a storm moves, and emergency managers must act on the newest warning while preparing for uncertainty in the exact place and time.
Part 1 covered preparations before landfall. This Part 2 follows what the forecast said, what reports recorded during the crossing, and how warnings were turned into evacuation and response actions. Part 3 looks separately at the damage, relief and recovery work after the storm.
1. What was forecast, and what was observed?
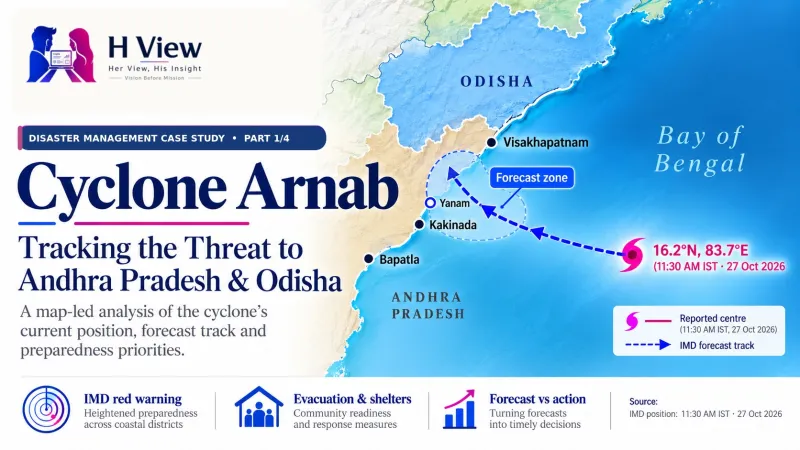
Before landfall, the India Meteorological Department (IMD) forecast a crossing in the broad Bapatla–Visakhapatnam coastal sector, south of Yanam. An IMD bulletin issued at 5:30 a.m. IST on 28 October said the very severe cyclonic storm was very likely to cross close to south of Yanam within the next two hours. It forecast maximum sustained winds of 115–125 km/h, gusting to 140 km/h. That was a time-specific bulletin; earlier bulletins had given different windows as the system developed.
IMD’s later account placed the crossing process between 2:00 a.m. and 8:00 a.m. on 28 October, near Narsapur and southwest of Yanam, in the expected coastal sector. Landfall reports described sustained winds around 125–135 km/h and gusts up to 150 km/h. Read carefully: the reported range was somewhat higher than the 5:30 a.m. forecast range, while the predicted coastal zone and severe intensity were broadly similar. The figures are rounded ranges from different updates, so they do not prove that every location experienced the same wind.
| Measure | Forecast before crossing | Reported during / after crossing | Student reading |
|---|---|---|---|
| Coastal area | Bapatla–Visakhapatnam sector, close south of Yanam | Near Narsapur, southwest of Yanam | Broad sector matched; exact point is narrower than forecast zone |
| Sustained wind | 115–125 km/h | 125–135 km/h at landfall reports | Reported range was slightly higher; values are rounded and source-specific |
| Gusts | Up to 140 km/h | Up to 150 km/h | Peak gust and sustained wind are different measures |
| Time | A short-range bulletin expected crossing within about two hours of 5:30 a.m. | Crossing process reported from 2:00 to 8:00 a.m. | The process lasted beyond that specific near-term window |
Bars use the same 0–150 scale. Forecast is from the 5:30 a.m. IMD bulletin; observed ranges are from landfall reports.
2. Why did the crossing take several hours?
“Landfall” is often used as if it were one instant. In a large cyclone, the centre approaches the coast, the eyewall and strongest winds move over land, and the centre finally crosses. Weather bands can stretch far from the centre. IMD therefore reported a crossing process, not a single moment that made the whole district safe. The 2:00–8:00 a.m. interval describes the coastal crossing operation; it does not mean the same wind blew everywhere for six hours.
A forecast window is also not a promise. The storm’s speed, track, size, coastal shape and interaction with land can change the arrival time. At 5:30 a.m., IMD’s “within the next two hours” was a short-range expectation for that update; the later six-hour crossing window includes the full process and an earlier start. These statements can look different because they describe different update times and definitions.
What forecasters expected at that issue time
Outer rain and wind bands reach the coast
Eyewall and centre move over land
Rain, wind and flooding can continue after landfall
 Also readCyclone Arnab Case Study: Before Landfall (Part 1)→
3. How did warnings become response actions?
Before the cyclone arrived, the Union government said the IMD was issuing regular bulletins and that the state had activated control rooms, arranged shelters and moved response teams. NDRF and SDRF teams were placed on standby or deployed, while district officials coordinated transport and evacuation. After the crossing, response priorities shifted to rescue checks, clearing blocked routes, checking power lines, restoring essential services and recording damage.
In a 29 October briefing, the Chief Minister said more than 28,000 people had been moved to rehabilitation centres and described seven review meetings over three days. These are government-reported operational figures. To judge whether the response worked, students would also need district-level information: who was moved, how many returned safely, whether shelters had water and medicine, what areas remained cut off, and how quickly power and roads were restored.
IMD bulletins and district instructions identify risk and timing.
Local teams arrange evacuation, transport and safe shelter.
Rescue teams check people, roads and dangerous structures.
Crews repair power, roads, water and communications.
What the numbers can and cannot tell us: an evacuation count shows how many people officials say were moved; it does not show whether all at-risk households were reached or whether the shelters met every need. Likewise, a count of deployed teams is a measure of capacity, not the final result. Part 3 examines the early damage and restoration reports in detail.
4. Was the forecast right—or did the cyclone go beyond it?
The fairest answer is: some elements matched closely, while the short-term timing and reported peak wind values differed. The forecast identified the right broad coastal sector and warned of very severe cyclone winds. The later landfall reports placed the centre in that broad zone, while listing sustained winds and gusts modestly above the 5:30 a.m. forecast bracket. The crossing process also extended beyond the “next two hours” estimate in that bulletin. This is why forecasters issue updates and managers plan for a range of possible conditions.
It would be inaccurate to say the storm was completely unexpected or that every forecast was wrong. It would also be too strong to claim that the forecast perfectly predicted the exact landfall point, minute and local wind. Forecast quality should be assessed across multiple bulletins, at the same issue time and with the same measure—track against track, sustained wind against sustained wind, and time window against observed crossing.
| Question for a student | Evidence to compare | Why it matters |
|---|---|---|
| Was the area forecast? | Bulletin’s coastal zone versus reported landfall area | A forecast zone is wider than an exact village or point |
| Was intensity close? | Sustained wind compared with sustained wind; gust with gust | Different wind measures cannot be mixed |
| Was timing exact? | Issue time, forecast window and full crossing interval | Forecasts update; a range is not a fixed appointment |
| Did warnings help? | Households reached, evacuations, shelter and rescue results | Good forecast and effective action are related but different |
5. What should students learn from the response?
First, use the newest official warning available for the place and time you are discussing. Second, keep the forecast date and issue time next to each number. Third, understand the difference between sustained wind and a short gust, and between the storm’s centre crossing and the period when dangerous weather affects the coast. Fourth, judge response with outcomes: safety, shelter, rescue, service restoration and support for affected families.
One practical lesson for disaster managers is to plan for uncertainty rather than wait for a perfect forecast. Transport, shelters, local warning messages and response teams need to be ready before the exact landfall point is known. After the event, the same records can help answer whether people were reached, which services failed and what should change before the next cyclone.
- Choose one dated IMD bulletin issued before landfall.
- Write down its expected coastal zone, time window and wind range.
- Compare those with the later landfall report, keeping wind types separate.
- List two response results you would need before calling the management successful.
 Also readCyclone Arnab Case Study: Damage, Relief and Recovery (Part 3)→
FAQs
Did Cyclone Arnab cross outside the area predicted by IMD?
The reported crossing near Narsapur, southwest of Yanam, was within the broad Bapatla–Visakhapatnam sector highlighted by IMD. A broad forecast zone is not the same as predicting one exact point.
Did the actual wind exceed the forecast?
The 5:30 a.m. bulletin forecast sustained winds of 115–125 km/h and gusts up to 140 km/h. Landfall reports cited 125–135 km/h sustained winds and gusts up to 150 km/h. The later reported ranges were somewhat higher, but they are rounded estimates from different updates and should be attributed to their sources.
Why do reports give different landfall times?
Some reports describe when the centre or strongest winds reached land; others describe the full crossing process. IMD reported a 2:00–8:00 a.m. process. Always name the bulletin and explain what its time refers to.
Does landfall mean the danger is over?
No. Rain, wind, flooding, damaged buildings and fallen power lines can remain dangerous after the centre moves inland. Follow local authorities and current IMD information.
Does moving more than 28,000 people prove the response succeeded?
It is an important reported action, but not a complete outcome measure. A full review needs to check who was at risk, who was reached, shelter conditions, rescue needs and whether essential services returned safely.
Conclusion: forecasts guide action; evidence tests results
Arnab’s forecast and crossing show why disaster management depends on timely updates and clear communication. IMD identified the broad coastal sector and warned of very severe winds; later reports described a somewhat higher wind range and a longer crossing process than the short-range two-hour expectation in one bulletin. The sensible conclusion is not “the forecast failed” or “everything was exact.” It is to compare each dated forecast with the matching observation, then judge how effectively authorities and communities acted on the warning.
Continue the series: Part 1 · Before landfall → Part 2 · Forecast, landfall and early response → Part 3 · Damage, relief and recovery.
Sources and evidence notes
- India Meteorological Department, National Bulletin No. 19, 27 October 2026 — earlier forecast for the broad coastal sector and intensity.
- India Meteorological Department, Coastal Bulletin, 28–29 October 2026 — short-range updates, crossing process and subsequent weakening; check issue time on the bulletin.
- Press Information Bureau, preparedness review, 27 October 2026 — official pre-landfall coordination and response readiness.
- The New Indian Express, 29 October 2026 — Chief Minister’s reported review meetings, evacuation and early restoration statements.
- Andhra Jyothy, 29 October 2026 — dated early response and power-restoration figures (Telugu report).
- H View · Part 1: Before landfall — preparedness background for this series.
Editorial note: Forecasts describe what was expected at a specific issue time; observed figures describe later reports. Keep the source, date, time window and measurement beside each comparison. This article is for learning and does not replace current official warnings.
H View stories follow our editorial policy. Spotted an error? Tell us and we will correct it.
Rate this article
One tap is enough. No comment needed.
Was this article helpful?
Your answer goes straight to our editors.











Comments0
No comments yet. Start the conversation.